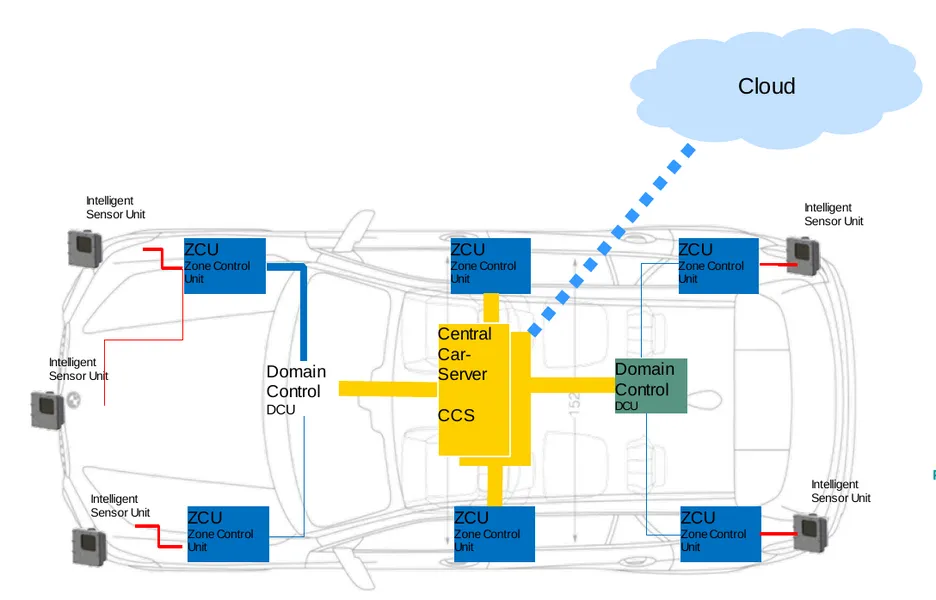
Mannheim EMDRIVE is a BMBF-funded project for the conception and realtime(RT)-compatible extension of central computing platforms and embedded compute networks for future highly automated vehicles. The project network consists of several industry partners from the automotive industry accompanied by partners from academia.
The overall goal of the partners in the course of the project is the development of a hierarchical, scalable platform concept for centralized high performance automotive RT-compute boardnets (Sensor2Edge) and the transfer of results to automotive industry. This can be broken down into the following subgoals within the project:
Embedded RT Compute Performance
Power Consumption
Dynamic, Distributed Computing
RT-Monitoring and Diagnosis
Our Contribution: RT Monitoring and Diagnosis
Modern vehicles already host 100+ Electronic Control Units (ECUs) running more than 100 million lines of code—and software complexity will only grow with autonomous-driving features. Because many sporadic, software-induced faults escape lab testing, vehicles need an in-field mechanism to observe, diagnose, and adapt throughout their lifetime.
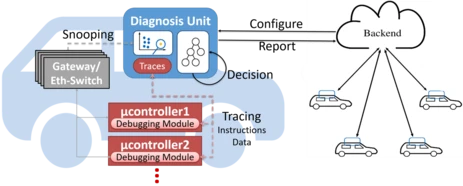
Our solution, the Diagnosis Unit (DU), delivers exactly that. Built as a modular HW/SW co-design that can be retro-fitted at a gateway’s mirror port, the DU provides cross-layer, real-time monitoring while remaining virtually invisible to normal in-vehicle operation.
How It Works
Ethernet-Traffic Snooping
The DU taps mirrored traffic on the zonal gateway and applies threshold- and ML-based analytics to detect anomalies such as timing irregularities, message-injection patterns, or traffic-burst deviations.
Microcontroller Trace Analysis
When a network anomaly is flagged, the DU remotely configures the target ECU’s Multi-Core Debug Solution (MCDS) via TAS, records a short execution trace, and analyzes CPU load, control-flow deviations, and timing violations.
Dynamic Anomaly Tree (DAT)
A runtime-reconfigurable tree links communication symptoms to likely processing-level root causes. The backend can update this tree on-the-fly across an entire fleet, turning every car into a collaborative diagnostics sensor.
Edge-to-Cloud Workflow
Heavy data (raw traces) is processed locally on a Zynq UltraScale+ ZCU102 platform (PL for packet parsing, PS for analysis). Only compact summaries—typically a few kB—are uploaded for fleet-wide orchestration and expert review, minimizing bandwidth overhead.
Why It Matters
Reconfigurable & Future-Proof – Cloud-driven updates let the DU adapt to new fault patterns without workshop visits.
Minimal Intrusion – Operates on mirrored Ethernet traffic; no extra latency or bandwidth impact on the IVN.
Comprehensive Coverage – Correlates system-level network symptoms with component-level execution traces, enabling root-cause insight instead of mere symptom reporting.
With its flexible architecture and fleet-coordinated intelligence, the Diagnosis Unit pushes automotive runtime monitoring beyond static OBD routines—empowering engineers to uncover and fix elusive, software-driven faults long after vehicles leave the factory floor.
Current work
Simulation of Zonal In-Vehicle Network Architectures Ongoing development and evaluation of Ethernet-based zonal IVNs using OMNeT++, modeling Time-Sensitive Networking (TSN) behavior and ECU communication flows across mirrored gateway ports.
AI-Based Ethernet Anomaly Detection Implementation of anomaly detection mechanisms using deep learning models such as LSTM autoencoders and Transformer architectures in Python (TensorFlow/Keras). These models aim to identify timing irregularities, unexpected traffic bursts, and ID sequence anomalies in live Ethernet traffic.
AUTOSAR Integration on Infineon AURIX (TC397) Development of diagnostic and control logic on Infineon AURIX TC397 microcontrollers, including AUTOSAR-compliant applications responsible for real-time vehicle sub-functionality (e.g., lane detection, control logic, actuation).
Real-Time Microcontroller Trace Collection via MCDS Leveraging the Multi-Core Debug Solution (MCDS) integrated in the AURIX TC397 to collect fine-grained execution traces. These traces are triggered and retrieved via the Tool Access Socket (TAS) server interface, and subsequently analyzed to detect processing anomalies such as excessive instruction duration, memory misaccesses, or execution flow deviations.
Trace Analysis and Cloud-Coordinated Diagnosis Development of a modular Trace Analyzer hosted on the Zynq UltraScale+ MPSoC, capable of identifying anomalous runtime behavior through timing and control-flow analysis. Diagnostic results are compiled into compact summaries and sent to a centralized cloud backend, which maintains a Dynamic Anomaly Tree (DAT) and orchestrates fleet-wide diagnosis strategies through over-the-air reconfiguration.
Comparative Analysis of Local vs. Cloud Processing Approaches
Description
In today’s data-driven world, processing approaches are typically divided between cloud-based solutions—with virtually unlimited resources—and localized processing, which is constrained by hardware limitations. While the cloud offers extensive computational power, localized processing is often required for real-time applications where latency and data security are critical concerns.
To bridge this gap, various algorithms have been developed to pre-process data or extract essential information before it is sent to the cloud.
The goal of this seminar is to explore and compare these algorithms, evaluating their computational load on local hardware and their overall impact on system performance.
Design and Deployment of a Lightweight On-Device Classifier for ECU Anomaly Categorization
Description
About the Project Modern vehicles rely on complex distributed systems and generate extensive runtime data from ECUs and in-vehicle networks. These data streams must be analyzed effectively to detect sporadic anomalies. The Diagnosis Unit (DU) currently has no integration with the cloud, which limits the possibility of remote configuration and coordination of local DU during runtime. In highly automated vehicles, real-time anomaly diagnosis is essential for safety, reliability, and early intervention. The current Diagnosis Unit (DU) architecture detects anomalies via Ethernet snooping and trace monitoring but lacks embedded intelligence to autonomously categorize anomalies.
Project Description This thesis aims to bridge that gap by developing and deploying a lightweight Machine Learning classifier capable of locally identifying the type of anomaly based on metadata (e.g., message rates, ID sequences) and trace-level indicators (e.g., control flow deviations, instruction durations, executed functions). The classifier must be tailored for low-power, runtime embedded systems like the ZCU102 board, ensuring it meets latency, memory, and CPU constraints.
The key tasks for this internship include:
Build an anomaly classification dataset using real and synthetic traces.
Design a minimal-overhead classifier suitable for embedded edge platforms.
Optimize the model for execution speed and memory footprint.
Integrate and validate the classifier within the DU software stack.
Quantitatively evaluate accuracy, timing, and resource utilization under realistic conditions
Key Responsibilities:
Dataset Generation: Create labeled datasets using synthetic trace injections and logged anomaly traces from Aurix boards.
Model Development: ? Design candidate classifiers using scikit-learn and/or TensorFlow Lite for Microcontrollers. ? Evaluate trade-offs: accuracy vs. latency vs. Footprint.
Embedded Integration: ? Port the final model to C/C++ for execution on the DU Processing System (Linux). ? Interface classifier with DU anomaly metadata and trace analyzer.
Evaluation: ? Test classifier on live or replayed data. ? Measure detection latency, false positives/negatives, inference time, and CPU/RAM usage.
Reporting & Documentation: ? Document training pipeline, performance evaluation, and embedded integration. ? Prepare thesis manuscript and possibly a conference/poster paper.
Prerequisites
Required Skills:
Proficiency in Python and C/C++.
Solid understanding of classification algorithms and ML evaluation metrics.
Knowledge of real-time systems, SoC platforms, or embedded diagnostics.
Familiarity with Linux-based systems, cross-compilation, and performance profiling.
(Optional) Experience with Zynq boards, TinyML, or vehicle diagnostics.
Expected Deliverables:
A functioning, embedded ML-based classification module for the DU.
Labeled dataset and training pipeline.
Comprehensive performance report (accuracy, timing, and system load).
Integration with DU demonstrator showing real-time anomaly categorization.
Final thesis manuscript and presentation.
Benefits:
Direct impact on enhancing autonomous diagnosis in smart automotive systems.
Hands-on deployment of real ML models in embedded systems.
Contribute to the first intelligent self-assessing DU prototype.
Potential for academic publication or continuation into research/industry projects.
Contact
Zafer Attal
zafer.attal@tum.de
Supervisor:
Zafer Attal
Open Work
If you are interested in any of the current work items that are mentioned above and there is currently no open position, please do not hesitate to contact Zafer Attal.
Completed Work
Non-Intrusive Monitoring of Core Utilization on a Multicore Automotive Control Unit (Master Thesis, 2023)
Simulation of Zonal-Architecture Intra-Vehicular Network with TSN Functionality (Teaching Assistant, 2022–2023)
Implementation of a Real-Time Diagnosis Unit Prototype on ZCU102 Designed and implemented a hardware/software co-design on a Zynq UltraScale+ MPSoC (ZCU102), splitting diagnostic tasks between the Programmable Logic (PL) for Ethernet packet parsing and the Processing System (PS) for trace analysis and backend communication.
Integration of Anomaly Detection in Ethernet Traffic Configured the DU to detect specific Ethernet anomalies such as timing deviations, burst inconsistencies, and traffic pattern changes, using empirical thresholds and real traffic profiles.
Aurix ECU Trace Triggering and Retrieval via TAS Connected the DU to Infineon Aurix TC397 boards using TAS to remotely configure, trigger, and retrieve execution traces via the Multi-Core Debug Solution (MCDS).
Demonstration Setup and Validation in a Simulated Function Chain Implemented a testbed with three Aurix boards simulating a Lane Keeping Assistant (LKA). Successfully validated end-to-end detection of communication anomalies, triggering of trace capture, and analysis of processing deviations.
Zafer Attal, Matthias Ernst, Gasper Skvarc, Ibai Irigoyen, Albrecht Mayer, Thomas Wild, Andreas Herkersdorf: An Approach for Automotive ECU Diagnosis via Ethernet Snooping & Microcontroller Tracing. 28th Euromicro Conference Series on Digital System Design (DSD) 2025, 2025 more…
Patrick Schmidt, Iuliia Topko, Matthias Stammler, Tanja Harbaum, Juergen Becker, Rico Berner, Omar Ahmed, Jakub Jagielski, Thomas Seidler, Markus Abel, Marius Kreutzer, Maximilian Kirschner, Victor Pazmino, Robin Sehm, Lukas Groth, Andrija Neskovic, Rolf Meyer, Saleh Mulhem, Mladen Berekovic, Matthias Probst, Manuel Brosch, Georg Sigl, Thomas Wild, Matthias Ernst, Andreas Herkersdorf, Florian Aigner, Stefan Hommes, Sebastian Lauer, Maximilian Seidler, Thomas Raste, Gasper Bozic, Ibai Irigoyen Ceberio, Muhammad Hassan, Albrecht Mayer: EMDRIVE Architecture: Embedded Computing And Diagnostics From Sensor To Edge. DATE 2024 - Design, Automation and Test in Europe Conference, 2024 more…
Gasper Skvarc Bozic, Ibai Irigoyen Ceberio, Matthias Ernst, Albrecht Mayer: A New Generation Automotive Tool Access Architecture for Remote in-Field Diagnosis. WCX SAE World Congress Experience 2023, 2023 more…